Field Measurement Study of Hydraulic Gradient in Flood Control Area of Wuhan Area
-
摘要: 根据《建筑地基基础技术规范》(DB 42/242—2014)规定,武汉地区防洪控制区内建议承压水头坡降为0.5%~0.8%,由此可近似推导防洪控制区内抗浮水位及基坑降水承压水水头。2003年以来,由于长江补给两岸时长的大幅缩短及城市建设大规模基坑降水,防洪控制区内相应水力梯度也发生较大改变,根据防洪控制区内40个项目水位观测统计数据,控制区内的实测水力梯度与规范建议值存在较大偏差,与长江水位、项目距离呈非线性衰减关系。通过数据分析,推导出丰水期峰值水力梯度、丰水期平均水力梯度、枯水期平均水力梯度曲线方程,并获得了实际项目验证。研究结论可为规范修订提供参考,同时为防洪控制区内抗浮水位选取及基坑工程降水提供支持。Abstract: According to “Technical Code for Building Foundation” (DB 42/242—2014), the recommended slope of confined water head in the flood control area of Wuhan is 0.5%~0.8%, from which the anti-floating water level in the flood control area and the confined water head of foundation pit dewatering can be approximately deduced. However, since 2003, due to the substantial shortening of the supply time on both sides of the Yangtze River and the large-scale foundation pit dewatering in urban construction, the corresponding hydraulic gradient in the flood control area has also changed greatly. Combined with the water level observation and statistical data of 40 projects in the flood control area, there is a large deviation between the measured hydraulic gradient in the control area and the recommended value of the code, and there is a non-linear attenuation relationship with the water level of the Yangtze River and the distance of the project. Through data analysis, the curve equations of peak hydraulic gradient in high water period, average hydraulic gradient in high water period and average hydraulic gradient in low water period were derived and verified by the project. The conclusion can provide reference for the revision of the code, and provide support for the selection of anti-floating water level in flood control area and dewatering of foundation pit engineering.
-
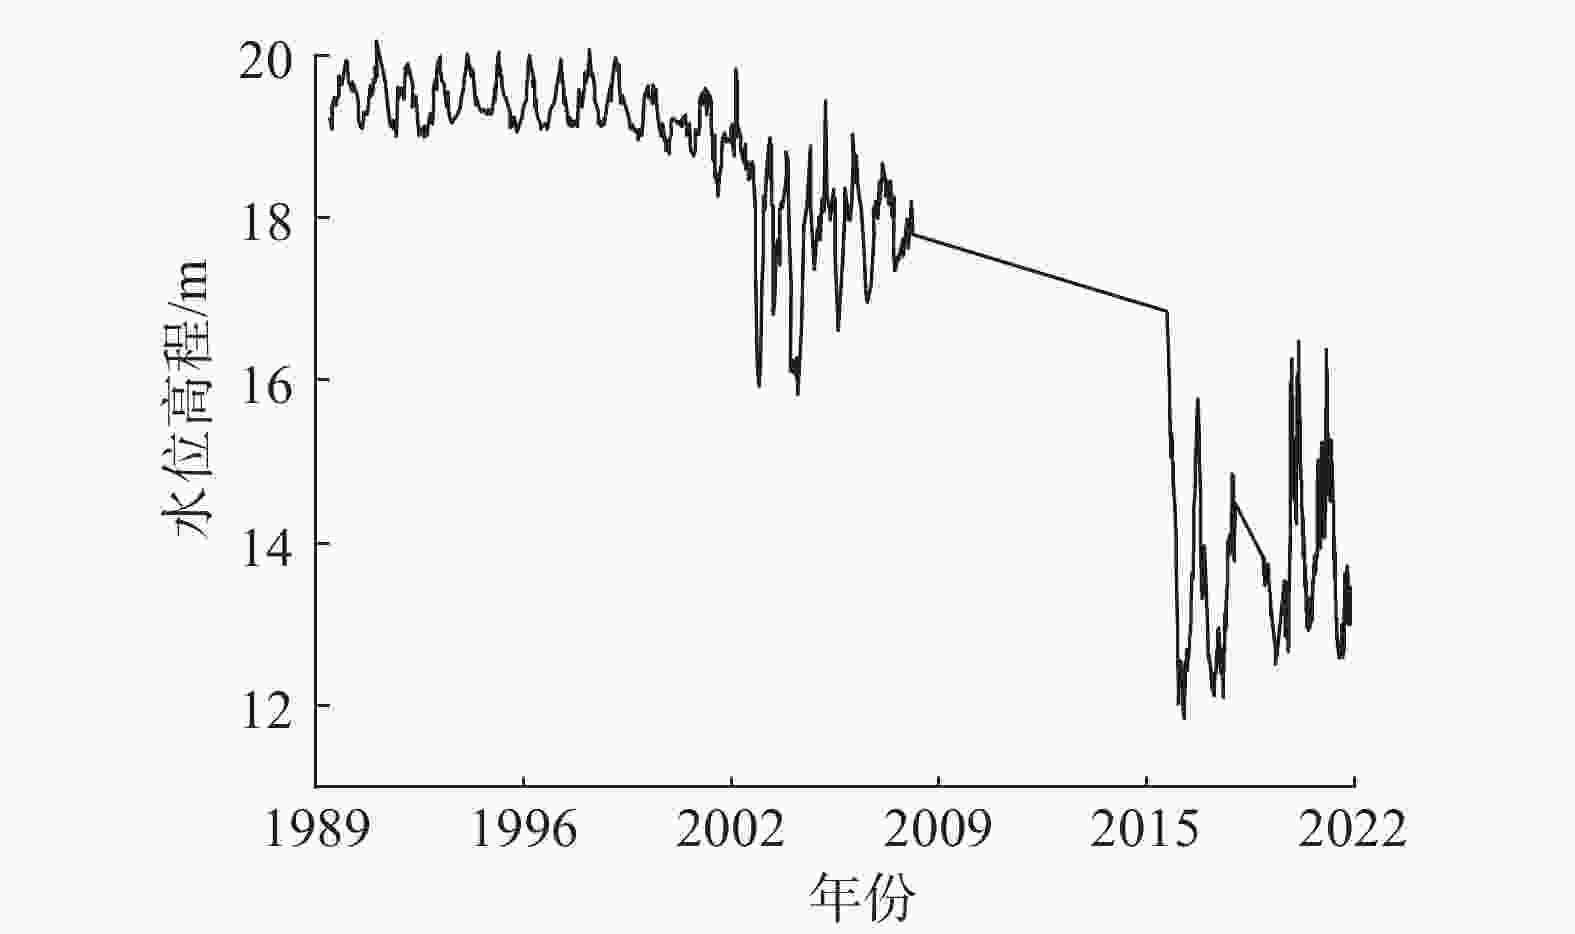
图 3 1989—2008/2016—2022年江岸区丹水池孔承压水位变化[18]
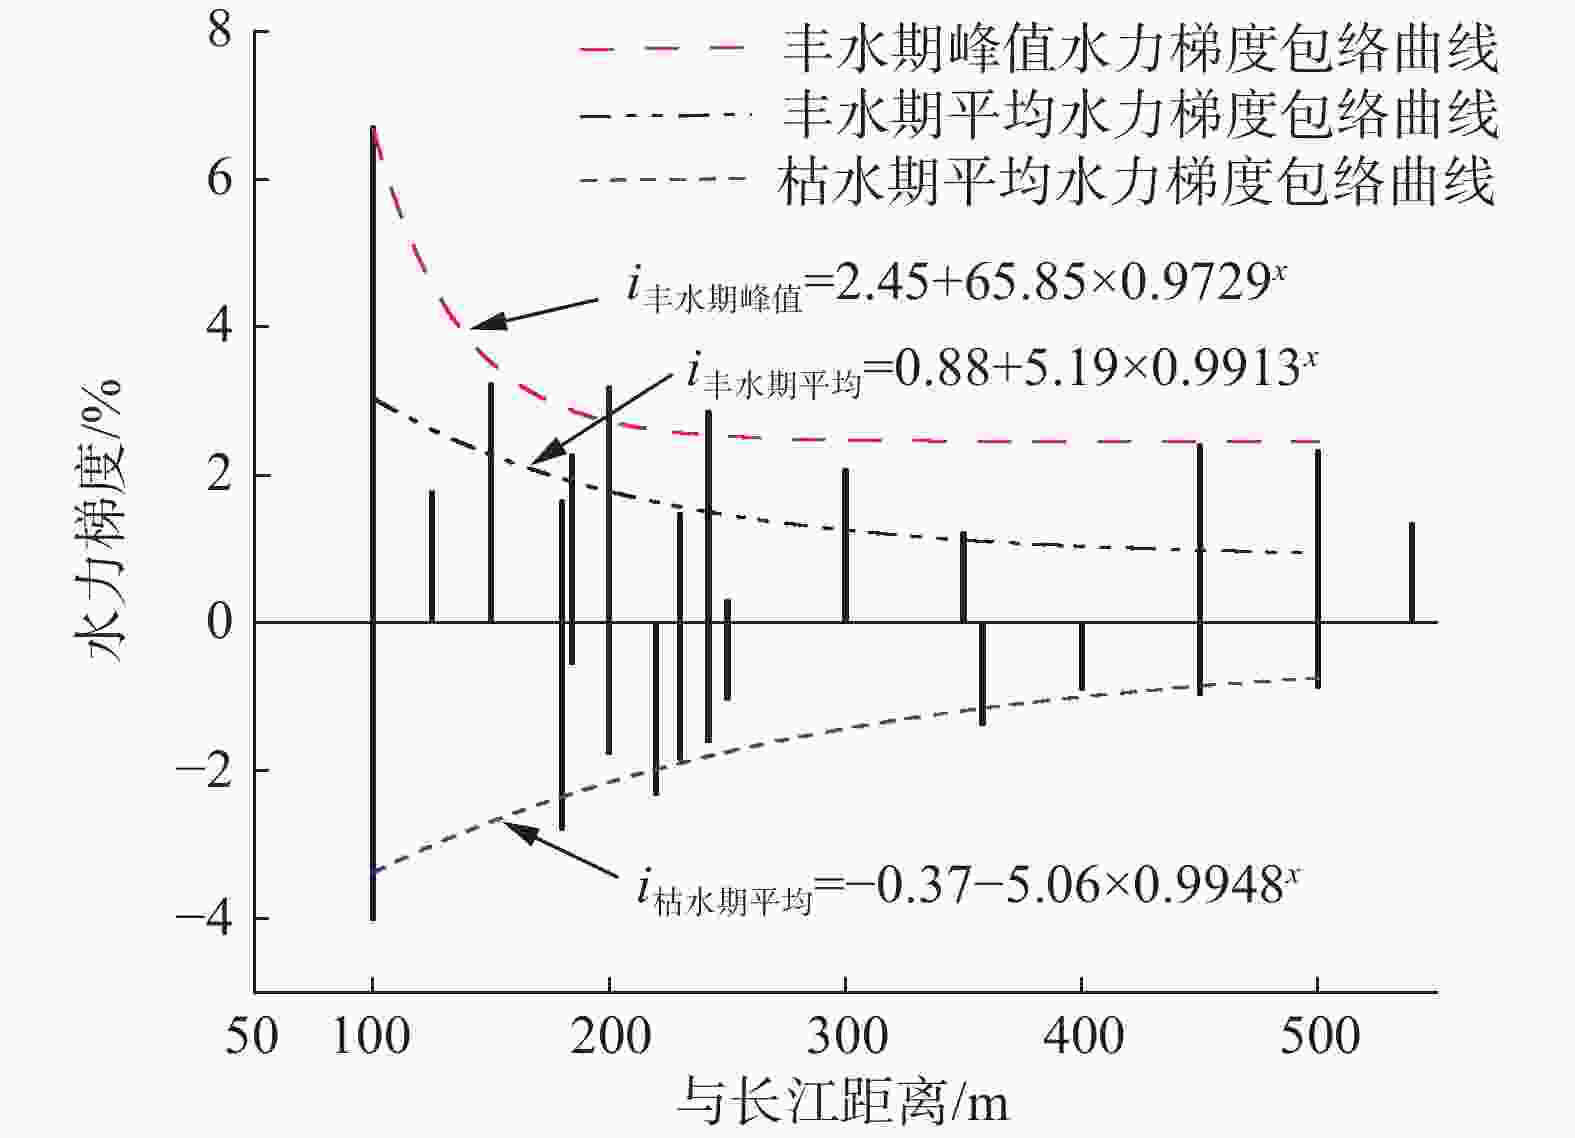
表 1 距离与水力梯度关系
距离/m 丰水期峰值
水力梯度/%丰水期平均
水力梯度/%枯水期平均
水力梯度/%100 6.67 3.04 −3.37 200 2.72 1.78 −2.15 300 2.47 1.26 −1.43 400 2.45 1.04 −1.00 500 2.45 0.95 −0.74 表 2 水力梯度实测值与计算值对比表
结果 丰水期峰值水力梯度/% 丰水期平均水力梯度/% 实测值 3.19 2.17 计算值 3.52 2.28 表 3 水力梯度实测值与计算值对比表
结果 丰水期峰值
水力梯度/%丰水期平均
水力梯度/%枯水期平均
水力梯度/%实测值 2.86 1.32 –1.41 计算值 2.54 1.51 –1.80 -
[1] 武汉市城乡建设委员会. 武汉市深厚软土区域市政与建筑工程地面沉降防控技术导则[S]. 武汉: 武汉市城乡建设委员会, 2015. [2] 马 郧, 徐光黎, 刘佑祥. 长江I级阶地某深基坑地下水控制分析[J]. 安全与环境工程,2012,19(5):144-149. doi: 10.3969/j.issn.1671-1556.2012.05.036 [3] 徐杨青, 朱小敏. 长江中下游一级阶地地层结构特征及深基坑变形破坏模式分析[J]. 岩土工程学报,2006,28(S1):1794-1798. doi: 10.3321/j.issn:1000-4548.2006.z1.110 [4] 徐光黎, 徐光大, 范士凯, 等. 地下水位变动对地下工程的危害分析[J]. 工程勘察,2015,43(1):41-44,58. [5] 胡 勇, 李云安, 李 波, 等. 承压水位变动下深大基坑空间效应离心试验与数值模拟[J]. 岩土力学,2018,39(6):1999-2007. [6] 范士凯, 杨育文. 长江一级阶地基坑地下水控制方法和实践[J]. 岩土工程学报,2010,32(S1):63-68. [7] 刘 波, 唐碧波, 李家洪, 等. 武汉绿地中心临江基坑超深地下连续墙施工技术[J]. 施工技术,2016,45(10):10-13. [8] 李 波, 喻志强, 李 玫, 等. 渗漏对武汉地区长江一级阶地地连墙结构基坑影响的离心模型试验研究[J]. 长江科学院院报,2020,37(3):78-81,89. doi: 10.11988/ckyyb.20181218 [9] DB 42/242—2014 湖北省建筑地基基础技术规范 [S]. [10] 郑 刚, 朱合华, 刘新荣. 基坑工程与地下工程安全及环境影响控制[J]. 土木工程学报,2016,49(6):1-24. [11] 李福清, 黎德琳, 李晓昭, 等. 长江漫滩区基坑支护与地下结构一体化设计及示范应用[J]. 建筑结构,2022,52(S1):2632-2636. [12] 霍晓波, 廖少明. 武汉I级阶地某地铁深基坑支护优化及实测分析[J]. 隧道建设,2016,36(1):71-79. doi: 10.3973/j.issn.1672-741X.2016.01.011 [13] 郑启宇, 夏小和, 李明广, 等. 深基坑降承压水对墙体变形和地表沉降的影响[J]. 上海交通大学学报,2020,54(10):1094-1100. [14] 郑 刚, 赵悦镔, 程雪松, 等. 复杂地层中基坑降水引发的水位及沉降分析与控制对策[J]. 土木工程学报,2019,52(S1):135-142. [15] 孙程鹏, 鞠海燕, 罗昌泰, 等. 软土地区深基坑开挖及降水变形性状分析[J]. 南昌工程学院学报, 2018,37(3): 41-45 [16] 李晓生. 富水深厚砂卵石地层深基坑降水引起的地层沉降预测[J]. 河南科技大学学报(自然科学版), 2023, 44(1): 77-82. [17] 李卫华, 刘天任, 洪小星, 等. 全断面富水砂性地层中地铁深基坑抽水回灌试验研究[J]. 南通大学学报(自然科学版),2021,20(1):65-74. [18] 范士凯. 土体工程地质宏观控制论的理论与实践[M]. 武汉: 中国地质大学出版社, 2017. -


 下载:
下载:
